import matplotlib.pyplot as plt
import matplotlib.patches as patches
from matplotlib.figure import Figure
from matplotlib.axes import Axes
def visualize_click(action: ClickAbsoluteAction, processed_img: Image.Image, task: str = "") -> tuple[Figure, Axes]:
"""
Visualize the navigation prediction on the image.
Args:
action: The parsed navigation step with action coordinates
processed_img: The processed PIL image
task: The task description for the title
Returns:
Tuple of matplotlib Figure and Axes objects
"""
fig, ax = plt.subplots(1, 1, figsize=(12, 8))
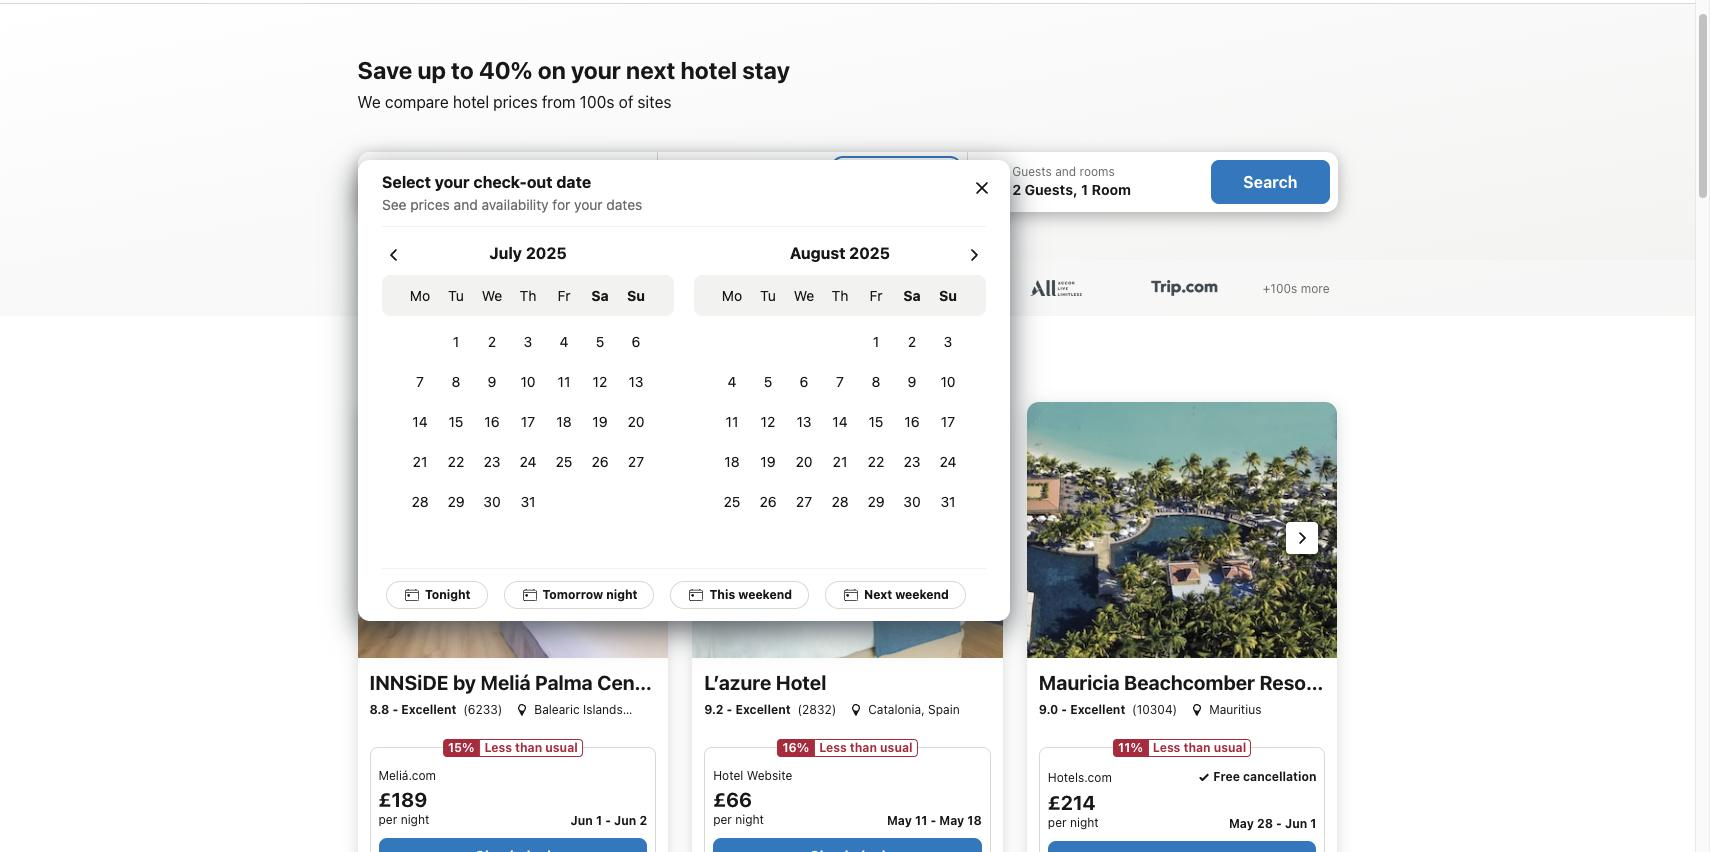
ax.imshow(processed_img)
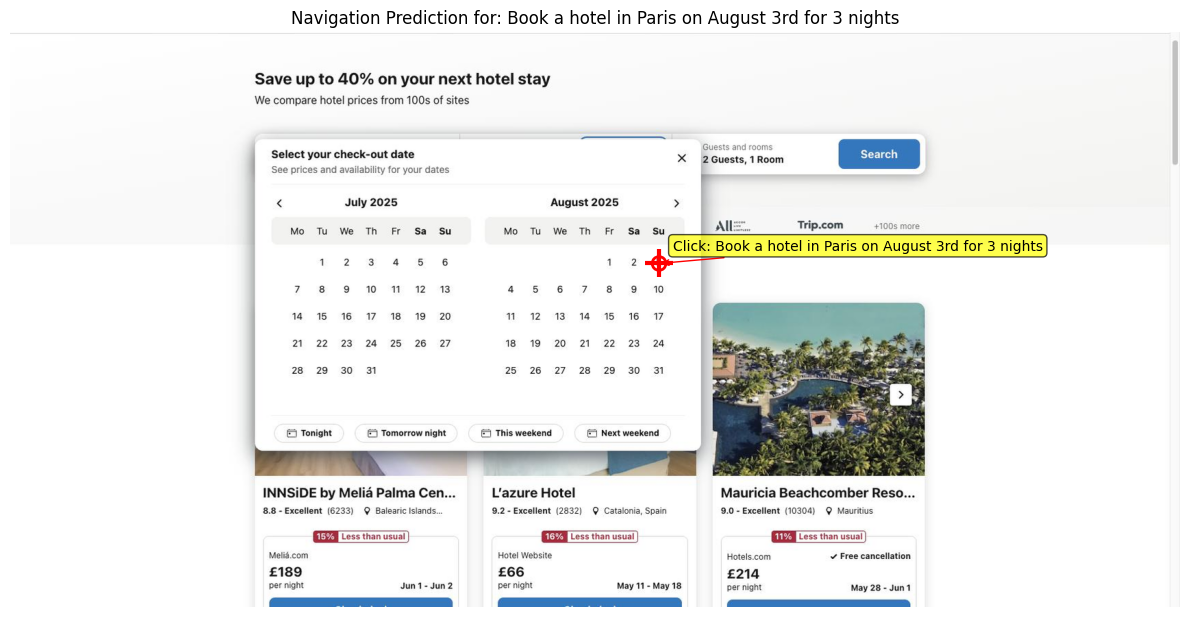
# Plot red cross at predicted coordinates
ax.plot(action.x, action.y, "r+", markersize=20, markeredgewidth=3)
# Add a circle around the cross for better visibility
circle = patches.Circle((action.x, action.y), 10, linewidth=2, edgecolor="red", facecolor="none")
ax.add_patch(circle)
# Add text annotation
if task:
ax.annotate(
f"Click: {task}",
xy=(action.x, action.y),
xytext=(action.x + 20, action.y - 20),
arrowprops=dict(arrowstyle="->", color="red"),
bbox=dict(boxstyle="round,pad=0.3", facecolor="yellow", alpha=0.7),
fontsize=10,
)
ax.set_title(f"Navigation Prediction for: {task}")
ax.axis("off")
plt.tight_layout()
return fig, ax
print(f"Predicted action: Click on '{task}' at coordinates ({action.x}, {action.y})")
fig, ax = visualize_click(action, processed_image, task=task)
plt.show()
.png)