.png)

Holo models
Below is a summary of how our models compare with each other:| Model | Size | Tensor type | General purpose | Use case |
|---|---|---|---|---|
| Holo2 30B A3B | 31B params | BF16 | A high-capacity research model designed for advanced UI understanding, policy learning, and complex multi-domain navigation tasks. | Best for research scenarios involving high-difficulty UI reasoning, large-screen environments, and advanced computer-use automation. |
| Holo2 8B | 8B params | BF16 | A stronger mid-scale VLM providing enhanced reasoning and cross-environment generalization for reliable multi-step computer-use tasks. | Suited for more complex multi-step workflows requiring stronger reasoning and robust cross-platform navigation. |
| Holo2 4B | 4B params | BF16 | A lightweight VLM optimized for efficient, accurate GUI navigation and action execution across web, desktop, and mobile environments. | Ideal for lightweight agents handling routine web, desktop, and mobile tasks with fast, efficient execution. |
| Holo1.5 72B | 73.4B params | BF16 | Highest accuracy, designed for cutting-edge research and advanced reasoning | Complex, large-scale enterprise tasks requiring maximum capability. |
| Holo1.5 7B | 8.29B params | BF16 | Balanced performance across accuracy, speed, and efficiency. | Versatile choice for production workloads and mid-scale applications. |
| Holo1.5 3B | 3.75B params | BF16 | Lightweight yet capable, optimized for responsiveness. | Ideal for common tasks on interactive applications |
| Holo1 7B | 8.29B params | BF16 | Higher accuracy and for large scale inference | Full-scale tasks |
| Holo1 3B | 3.75B params | BF16 | Optimized for efficiency, running locally and hardware | Common tasks |
Comparing with other models
Below is a summary of how our models compare with competitor models:Holo2
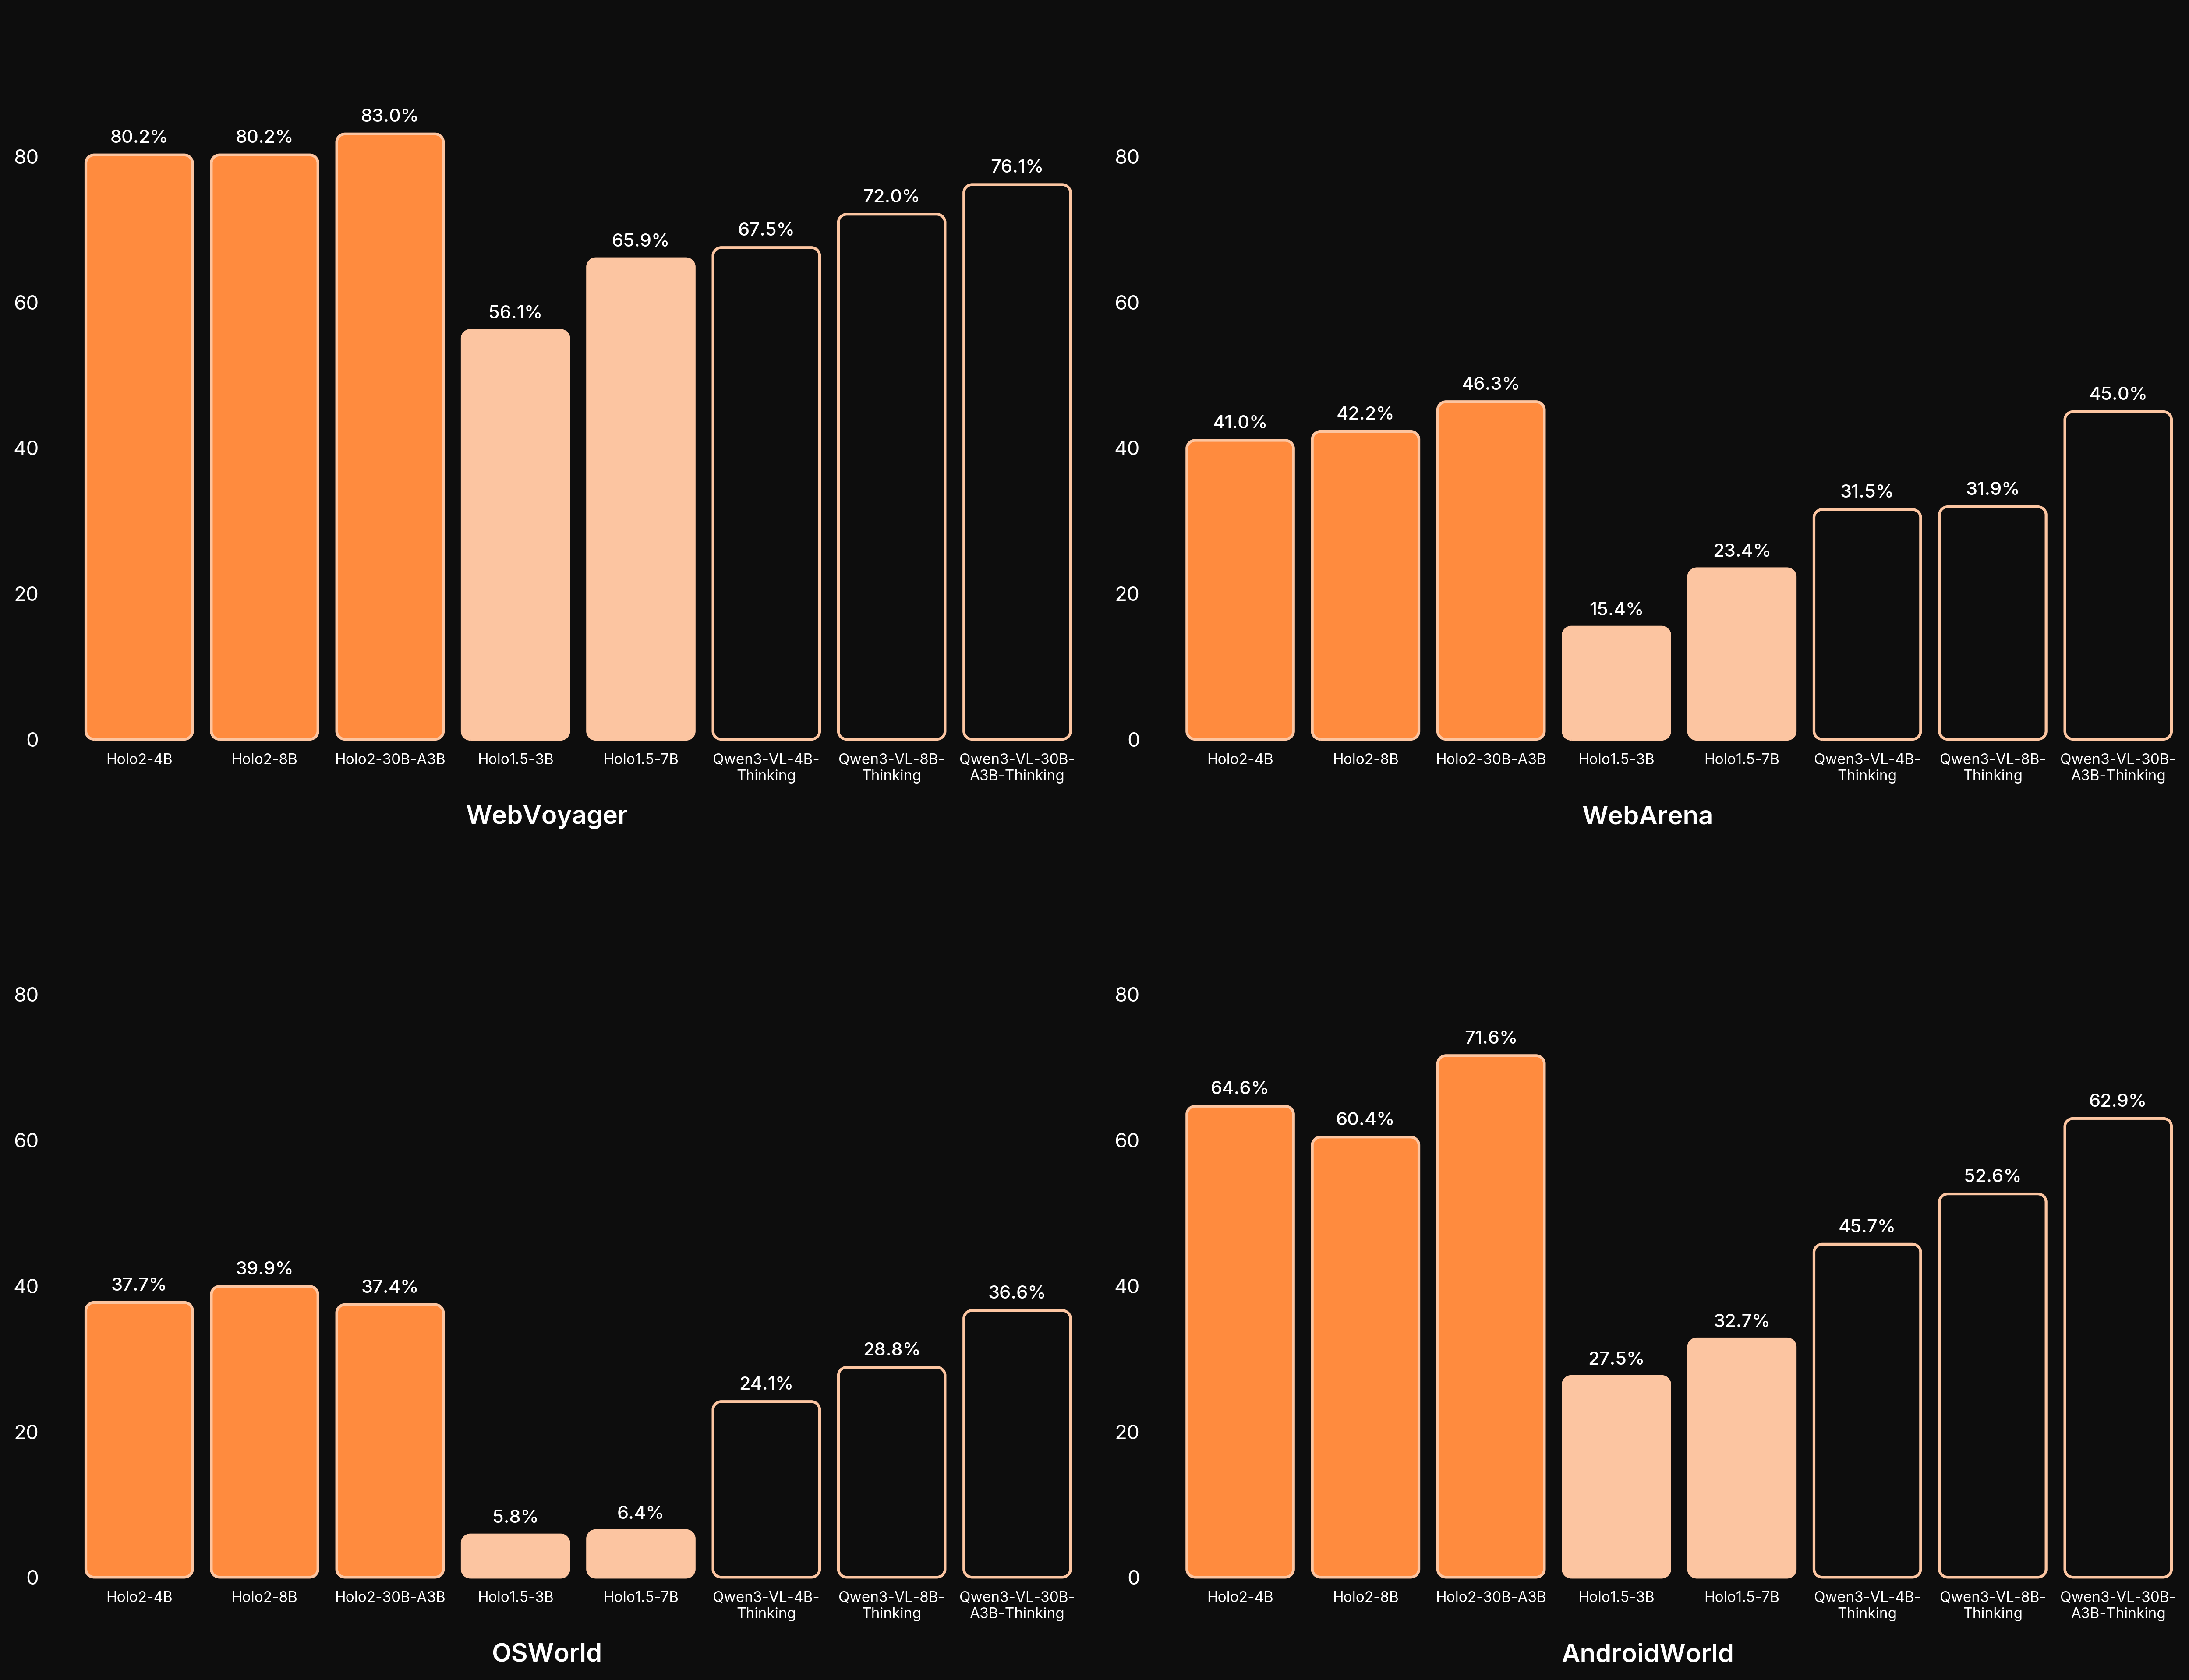
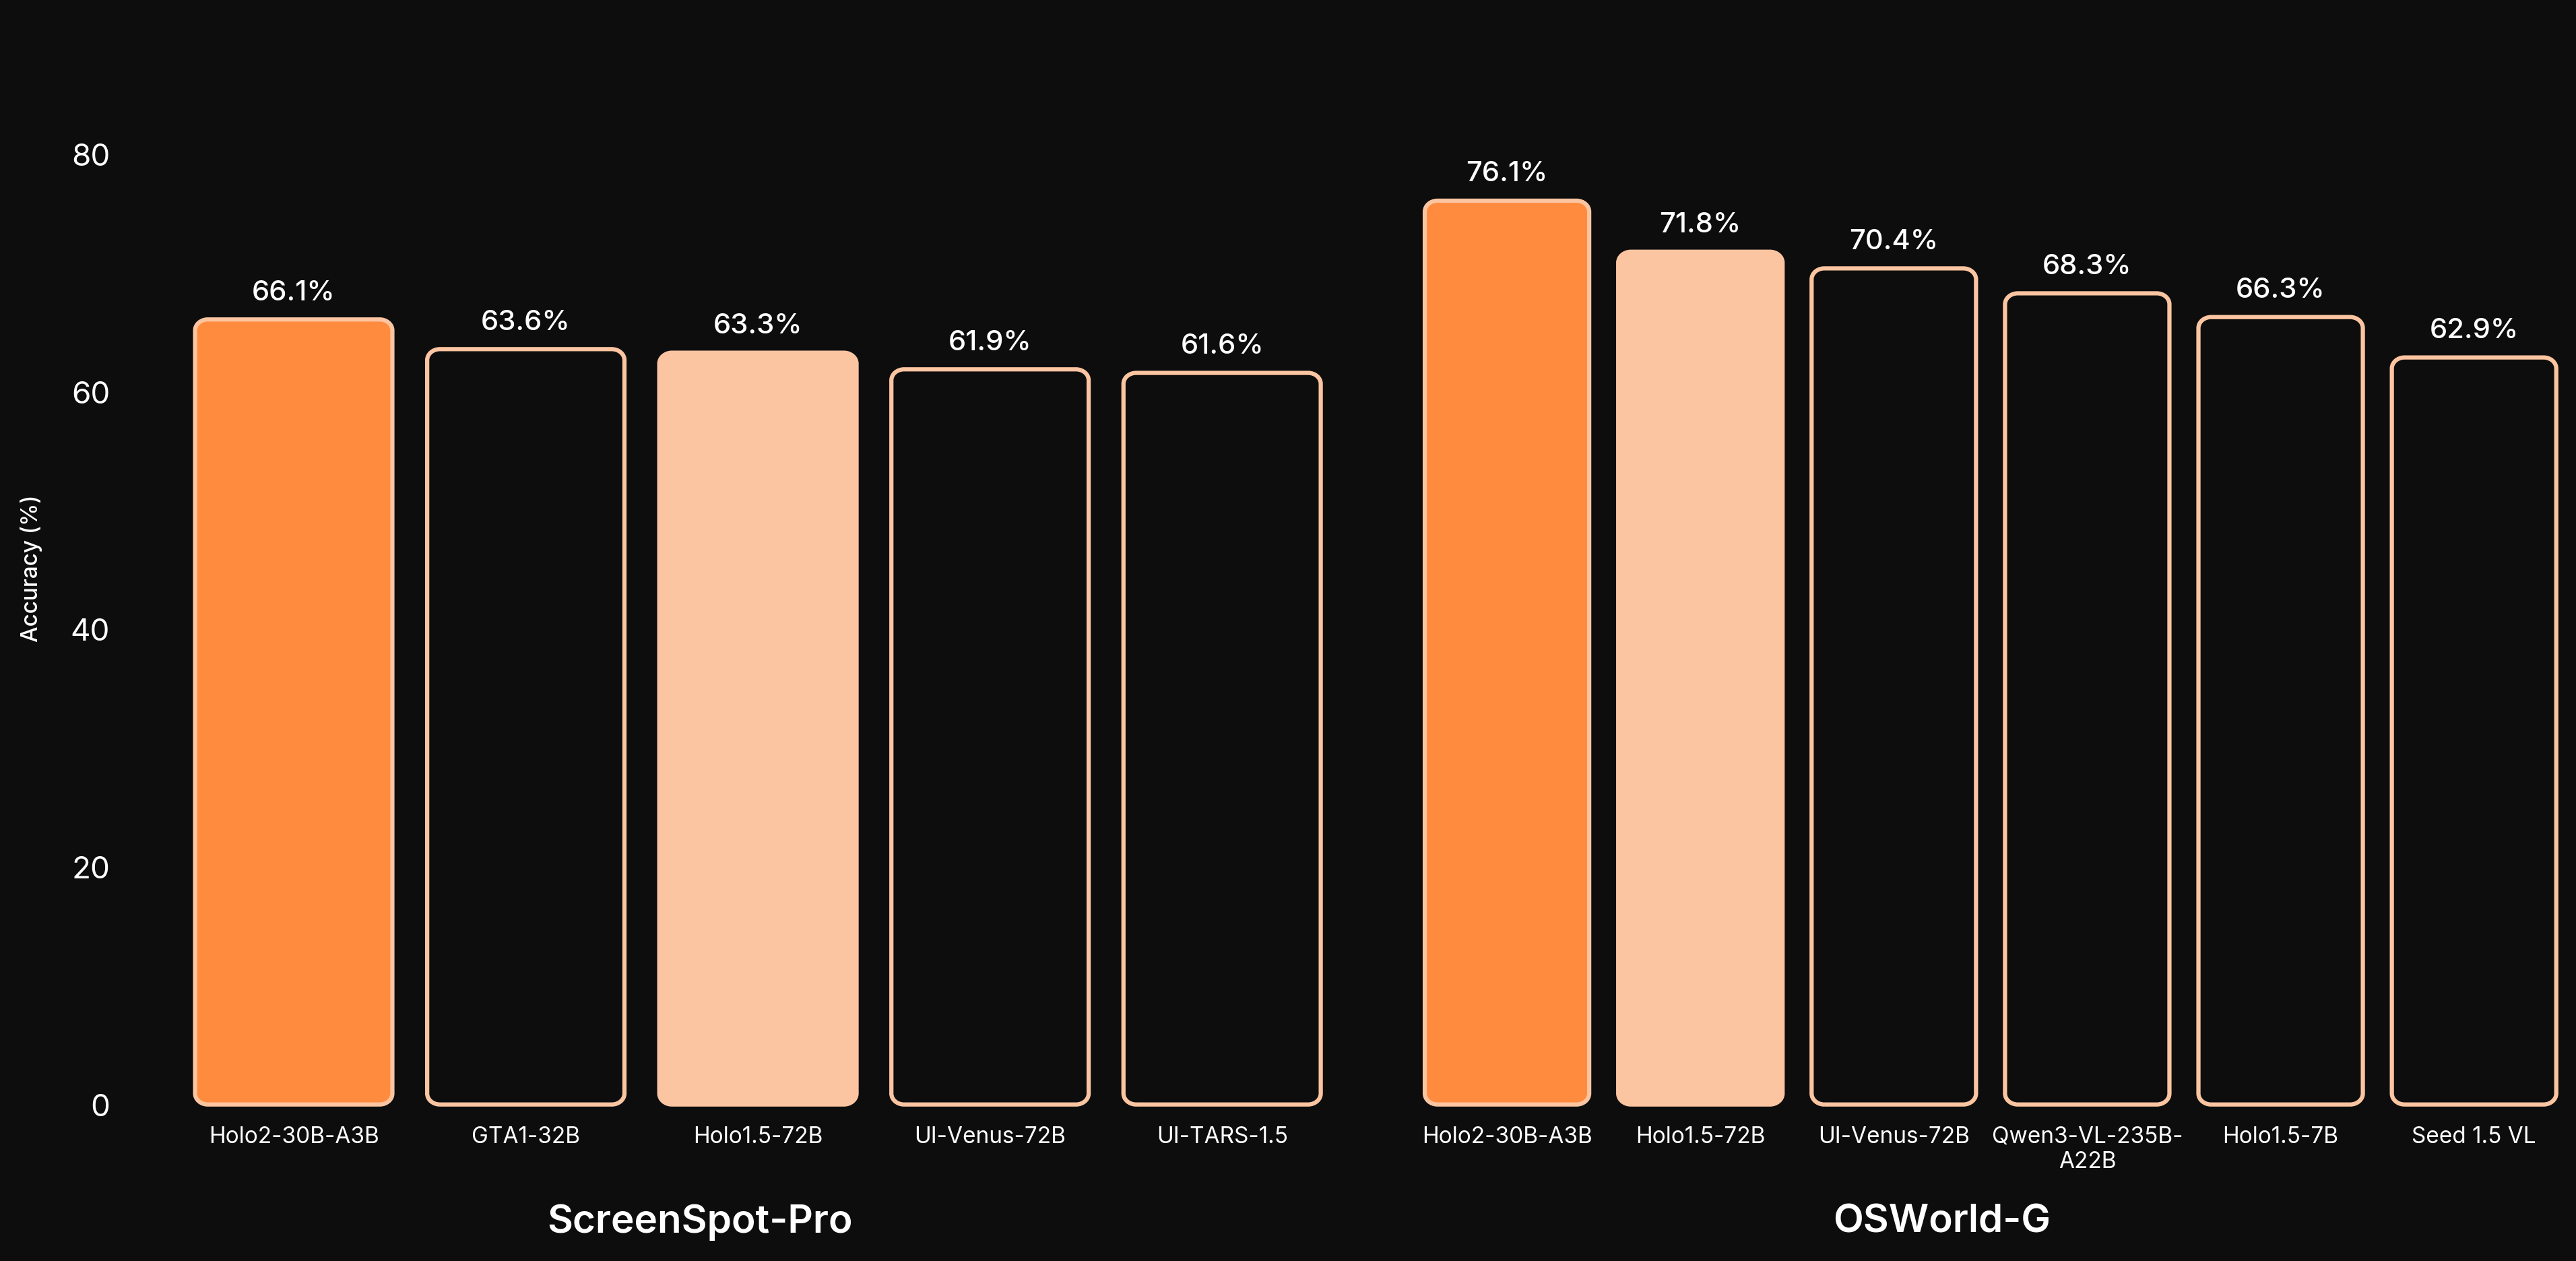
The charts and table below demonstrate how Holo2 compares with competing models in both navigation performance and UI Localization. UI Localization is the agent’s ability to find and interact with specific parts of a user interface. Navigation performance, on the other hand, evaluates an agent’s ability to complete real or simulated tasks through multi-step reasoning and action.Navigation Performance
| Model | WebVoyager | WebArena | OSWorld | AndroidWorld | Average |
|---|---|---|---|---|---|
| Holo2-30B-A3B | 83.0% | 46.3% | 37.4% | 71.6% | 59.6% |
| Holo2-8B | 80.2% | 42.2% | 39.9% | 60.4% | 55.7% |
| Holo2-4B | 80.2% | 41.0% | 37.7% | 64.6% | 55.9% |
| Holo1.5-7B | 65.9% | 23.4% | 6.4% | 32.7% | 32.1% |
| Holo1.5-3B | 56.1% | 15.4% | 5.8% | 27.5% | 26.2% |
| Qwen3-VL-30B-A3B-Thinking | 76.1% | 45.0% | 36.6% | 62.9% | 55.1% |
| Qwen3-VL-8B-Thinking | 72.0% | 31.9% | 28.8% | 52.6% | 46.3% |
| Qwen3-VL-4B-Thinking | 67.5% | 31.5% | 24.1% | 45.7% | 42.2% |
UI Localization
ScreenSpot-Pro | OSWorld-G | Showdown | Ground-UI-1K | WebClick-v1 | ScreenSpot-v2 | Average | |
|---|---|---|---|---|---|---|---|
| Holo2-30B-A3B | 66.1% | 76.1% | 77.6% | 85.4% | 91.3% | 94.9% | 81.90 |
| Holo2-8B | 58.9% | 70.1% | 72.5% | 83.8% | 89.5% | 93.2% | 78.00 |
| Holo2-4B | 57.2% | 69.4% | 74.7% | 83.3% | 88.8% | 93.2% | 77.77 |
| Holo1.5-72B | 63.3% | 71.8% | 76.8% | 84.5% | 92.4% | 94.4% | 80.52 |
| Holo1.5-7B | 57.9% | 66.2% | 72.1% | 84.0% | 90.2% | 93.3% | 77.28 |
| Holo1.5-3B | 51.4% | 61.5% | 67.5% | 83.2% | 81.4% | 91.6% | 72.77 |
| Qwen3-VL-30B-A3B-Thinking | 49.9% | 65.8% | 71.2% | 84.2% | 89.5% | 91.8% | 75.40 |
| Qwen3-VL-8B-Thinking | 38.5% | 56.0% | 64.2% | 83.6% | 85.9% | 91.5% | 69.95 |
| Qwen3-VL-4B-Thinking | 41.4% | 56.4% | 66.6% | 84.1% | 85.8% | 90.0% | 70.72 |
| Qwen2.5-VL-72B | 55.6% | 62.0% | 41.0% | 85.4% | 88.3% | 93.3% | 70.93 |
| Qwen2.5-VL-7B | 29.0% | 40.6% | 52.0% | 80.7% | 76.5% | 85.6% | 60.73 |
| Qwen2.5-VL-3B | 29.3% | 34.3% | 50.3% | 76.4% | 71.2% | 80.7% | 57.03 |
| UI-TARS-1.5-7B | 39.0% | 61.0% | 58.0% | 84.0% | 86.1% | 94.0% | 70.35 |
| UI-Venus-72B | 61.9% | 70.4% | 75.6% | 75.5% | 77.0% | 95.3% | 75.95 |
| UI-Venus-7B | 50.8% | 58.8% | 67.3% | 82.3% | 84.4% | 94.1% | 72.95 |
Holo1.5
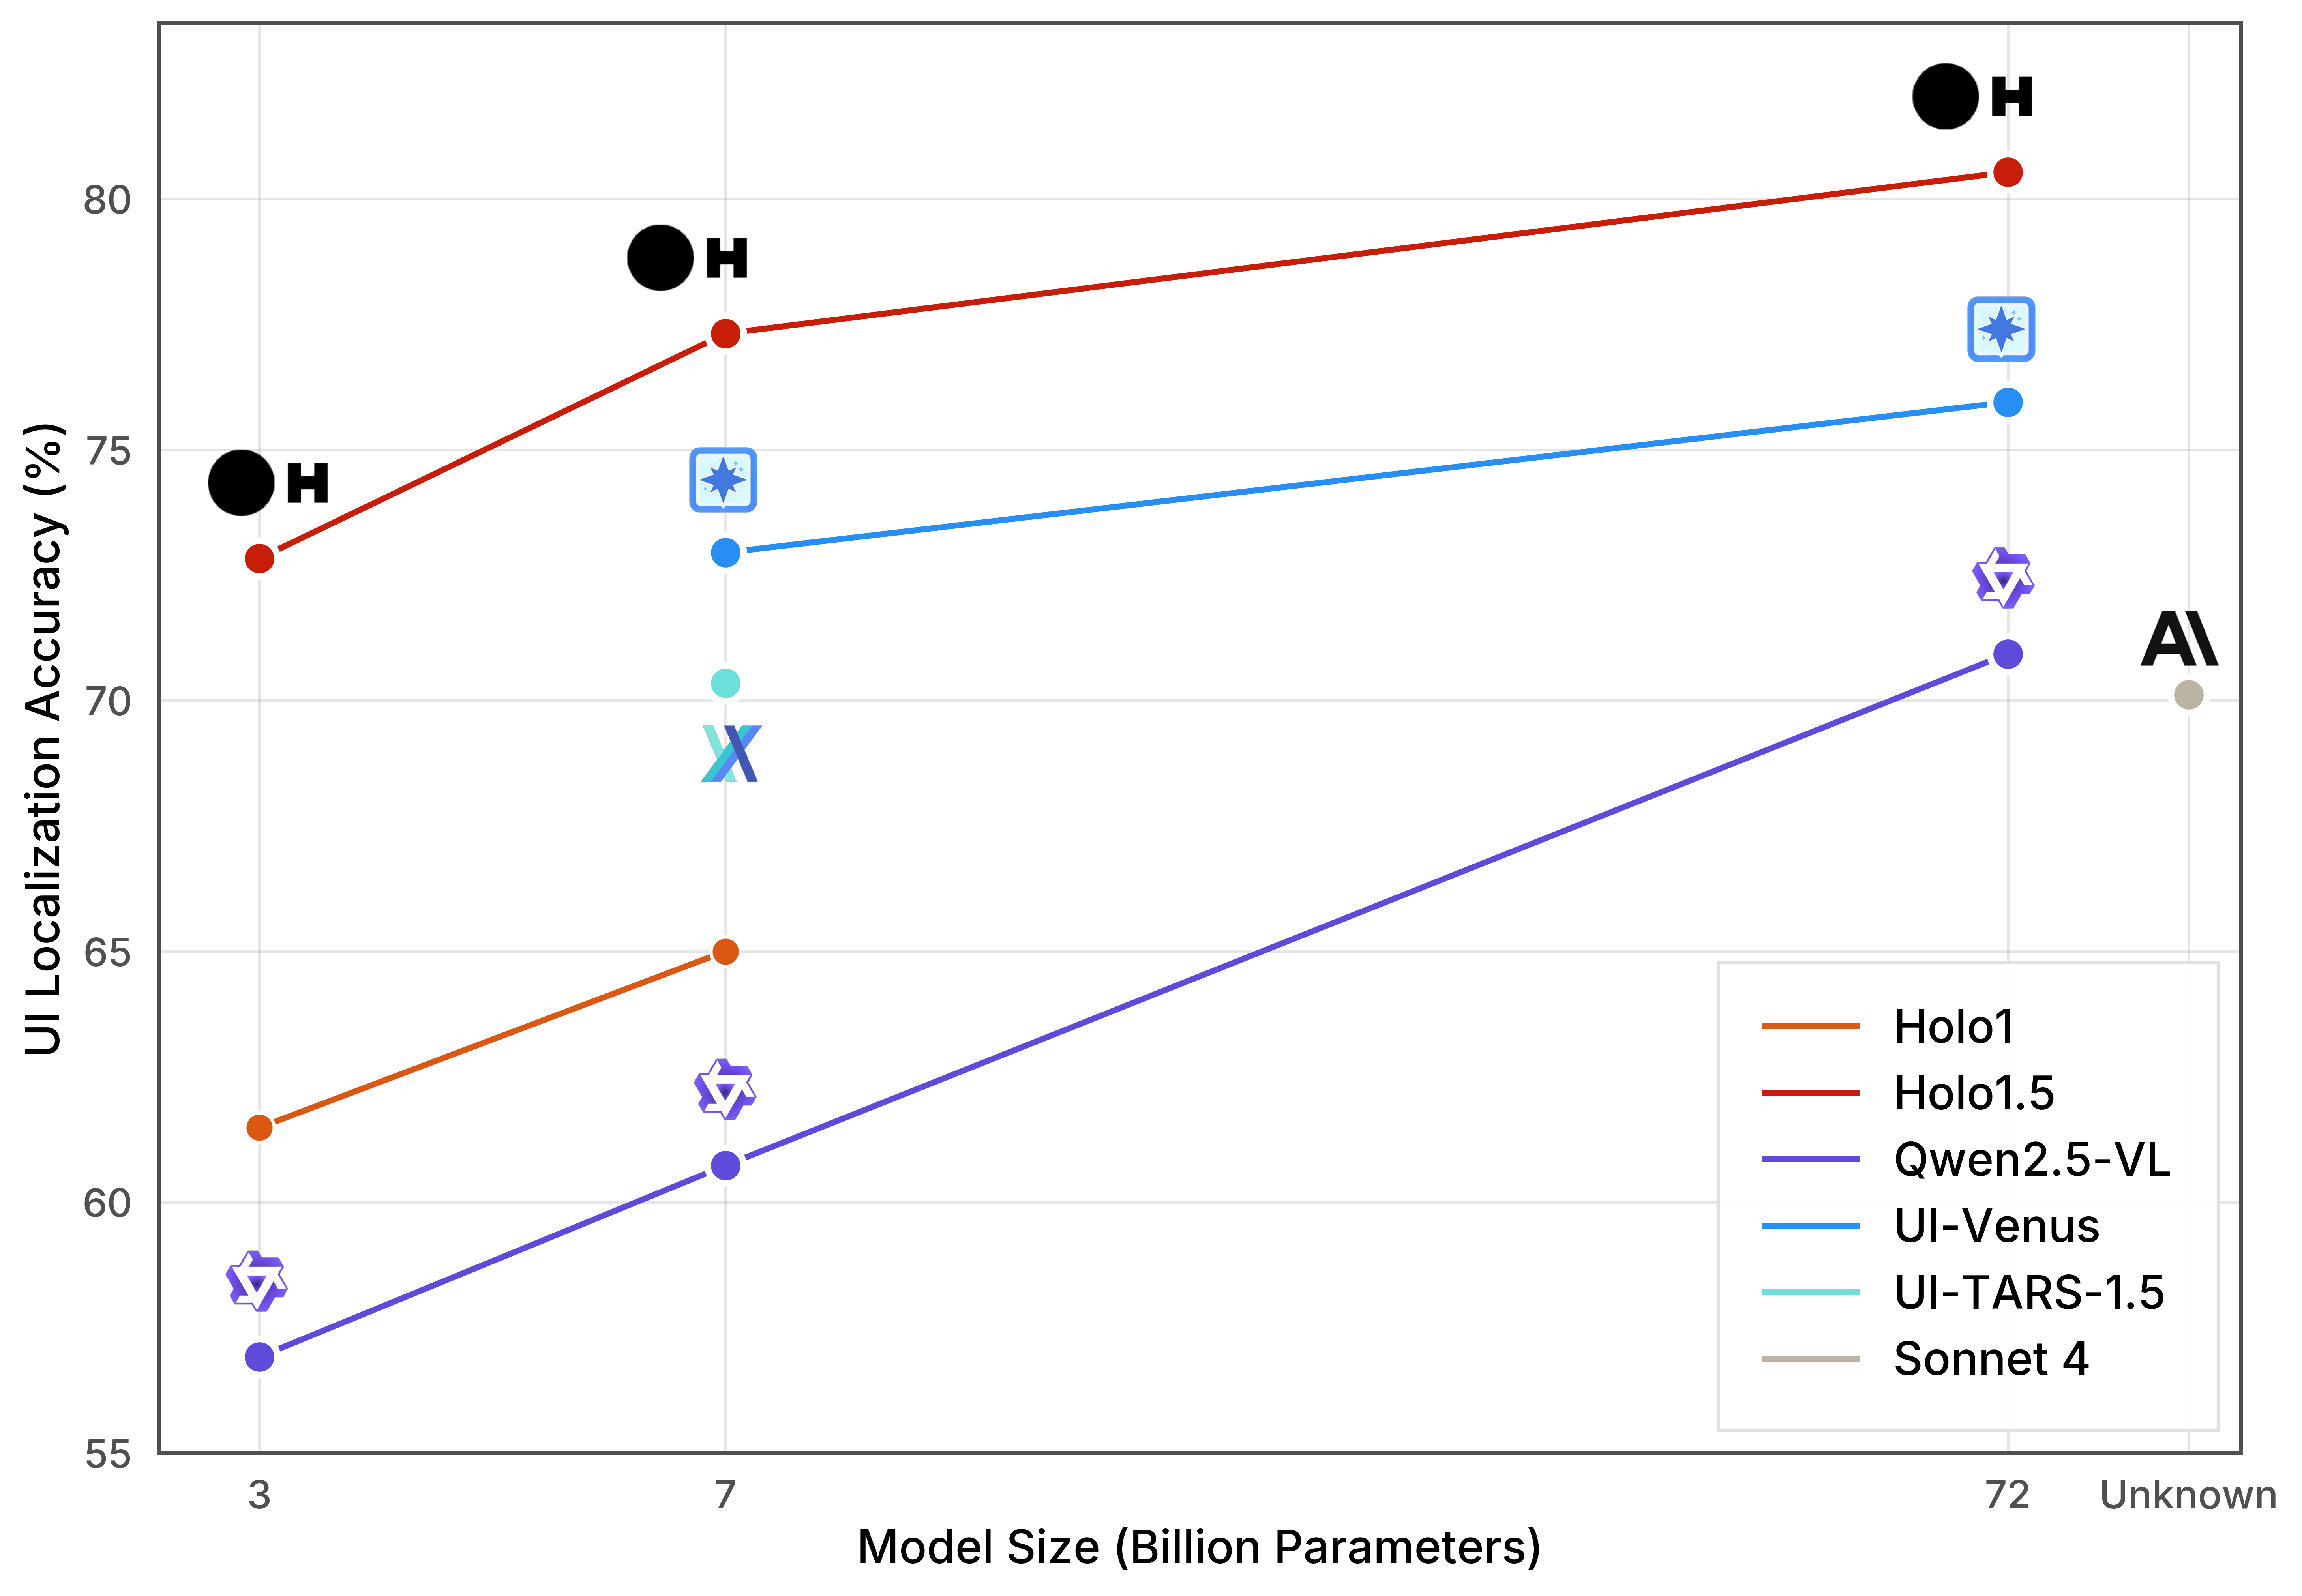
The charts and table below demonstrate how Holo1.5 compares with competing models in both UI Localization and Screen Content Understanding via Question Answering. UI Localization is the agent’s ability to find and interact with specific parts of a user interface. Screen Content Understanding via Question Answering, on the other hand, refers to the agent’s understanding of a UI structurally and functionally, based on the quality of the answers it provides.State-of-the-art (SOTA) UI Localization
| WebClick | Showdown | ScreenSpot-v2 | ScreenSpot-Pro | Ground-UI-1K | OSWorld-G | Average | |
|---|---|---|---|---|---|---|---|
| Holo1.5-3B | 81.45 | 67.50 | 91.66 | 51.49 | 83.20 | 61.57 | 72.81 |
| Holo1.5-7B | 90.24 | 72.17 | 93.31 | 57.94 | 84.00 | 66.27 | 77.32 |
| Holo1.5-72B | 92.43 | 76.84 | 94.41 | 63.25 | 84.50 | 71.80 | 80.54 |
| Qwen2.5-VL-3B | 71.20 | 50.30 | 80.00 | 29.30 | 76.40 | 34.31 | 56.92 |
| Qwen2.5-VL-7B | 76.51 | 52.00 | 85.60 | 29.00 | 80.70 | 40.59 | 60.73 |
| Qwen2.5-VL-72B | 88.29 | 41.00 | 93.30 | 55.60 | 85.40 | 61.96 | 70.93 |
| UI-TARS-1.5-7B | 86.10 | 58.00 | 94.00 | 39.00 | 84.20 | 61.40 | 70.45 |
| Holo1-7B | 84.04 | 64.27 | 89.85 | 26.06 | 78.50 | 47.25 | 65.00 |
| Holo1-3B | 79.35 | 59.96 | 88.91 | 23.66 | 74.75 | 42.16 | 61.47 |
| UI-Venus-7B | 84.44 | 67.32 | 94.10 | 50.80 | 82.30 | 58.80 | 72.96 |
| UI-Venus-72B | 77.00 | 75.58 | 95.30 | 61.90 | 75.50 | 70.40 | 75.95 |
| Sonnet 4 | 93.00 | 72.00 | 93.00 | 19.10 | 84.00 | 59.60 | 70.12 |
Screen Content Understanding via Question Answering
| VisualWebBench | WebSRC | ScreenQAShort | ScreenQAComplex | Average | |
|---|---|---|---|---|---|
| Holo1.5-3B | 78.50 | 94.80 | 87.90 | 81.40 | 85.65 |
| Holo1.5-7B | 82.60 | 95.90 | 91.00 | 83.20 | 88.17 |
| Holo1.5-72B | 83.80 | 97.20 | 91.90 | 87.10 | 90.00 |
| Qwen2.5-VL-3B | 58.00 | 93.00 | 86.00 | 76.00 | 78.25 |
| Qwen2.5-VL-7B | 69.00 | 95.00 | 87.00 | 81.10 | 83.02 |
| Qwen2.5-VL-72B | 76.30 | 97.00 | 87.90 | 83.20 | 86.10 |
| UI-TARS-1.5-7B | 79.70 | 92.90 | 88.70 | 79.20 | 85.12 |
| Holo1-3B | 54.10 | 93.90 | 78.30 | 53.50 | 69.95 |
| Holo1-7B | 38.10 | 95.30 | 83.30 | 65.10 | 70.45 |
| UI-Venus-7B | 60.90 | 96.60 | 86.30 | 82.30 | 81.52 |
| UI-Venus-72B | 74.10 | 96.70 | 88.60 | 83.30 | 85.67 |
| Claude-Sonnet-4 | 58.90 | 96.00 | 87.00 | 75.70 | 79.40 |
Holo1
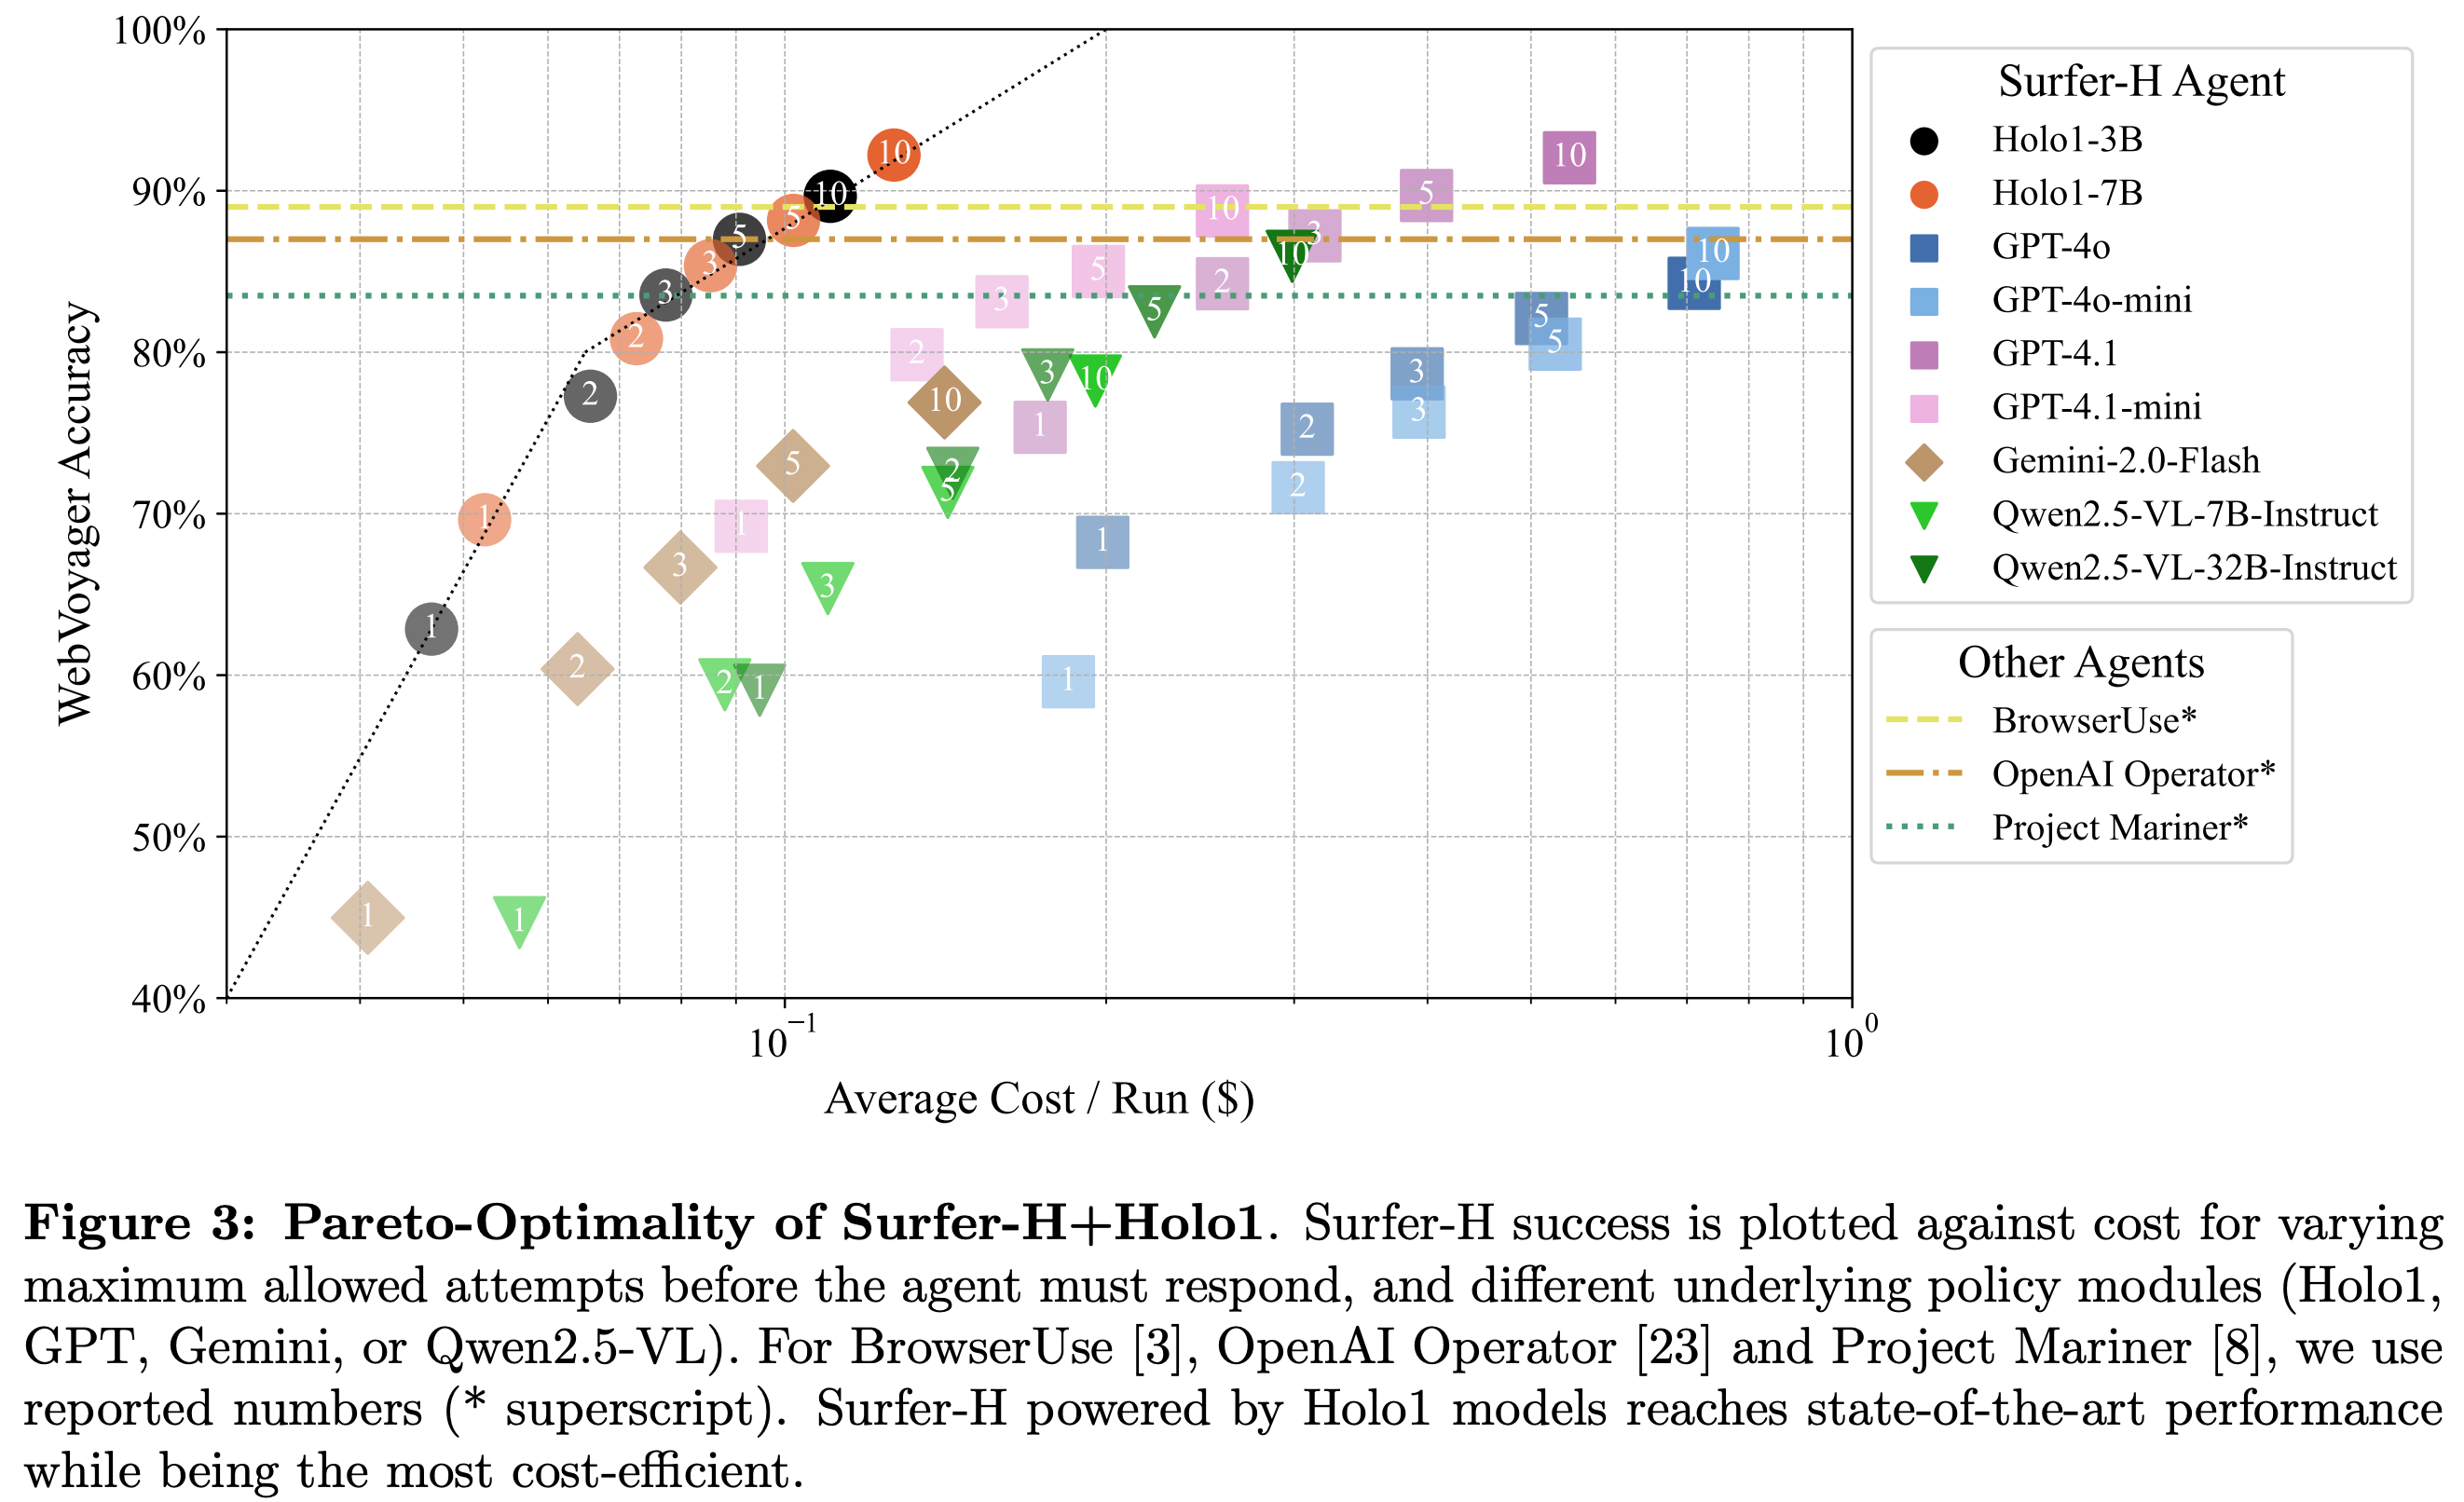
The charts below demonstrate how Holo1 compares with competing models as a Localizer. Pareto-optimal performance on WebVoyager refers to how the mode performs on the WebVoyager benchmark, offering the best accuracy/cost tradeoff among current models. UI Localization is the agent’s ability to find and interact with specific parts of a user interface.Surfer-H: Pareto-Optimal Performance on WebVoyager

State-of-the-Art (SOTA) UI Localization